HOWTO: Monitor a Process in Linux using vRealize Operations - Endpoint Operation Management - Part 1
Endpoint Operations Management EPOPS Linux VMware vRealize Operations
Published on 20 April 2016 by Christopher Lewis. Words: 409. Reading Time: 2 mins.
Introduction
This is Part 1 of a series on Monitoring Processes in Linux using VMware vRealize Operations Endpoint Operations Management.
The other posts in the series are:
- Creating a MultiProcess Object for a single Linux Machine
- Creating a MultiProcess Object for a Linux Machine (via Inventory Explorer)
- Creating Object Relationships
- Identifying the correct process.query string
I have been working with a customer recently around migrating their Linux based monitoring form their incumbent monitoring tool into vRealize Operations End Point Operations Management. For those who don’t know, from VMware vRealize Operations 6.1, VMware have started to migrate some of the functionality of the (seemingly deprecated) VMware vRealize Hyperic Monitoring tool into the native functionality of VMware vRealize Operations.
Whilst the general monitoring of the operating system is included Out of the Box, the monitoring of processes in Linux is slightly more complicated.
Firstly, coming from a predominantly Windows background, what I knew about Linux I could have written on the back of a fag packet - which, dare I be so bold, is more information than some of the designs I have reviewed in my career.
However, the requirement was to monitoring the Availability and Utilisation of (amongst others) cron and sshd.
I am currently using a bare bones CentOS 7 image with the vRealize Endpoint Operations Agent 6.2.x (vRealize-Endpoint-Operations-Management-Agent-x86-64-linux-6.2.0-3404388.rpm) installed with integrated Java.
Step By Step Guide
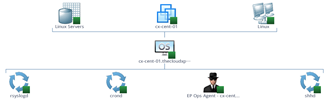
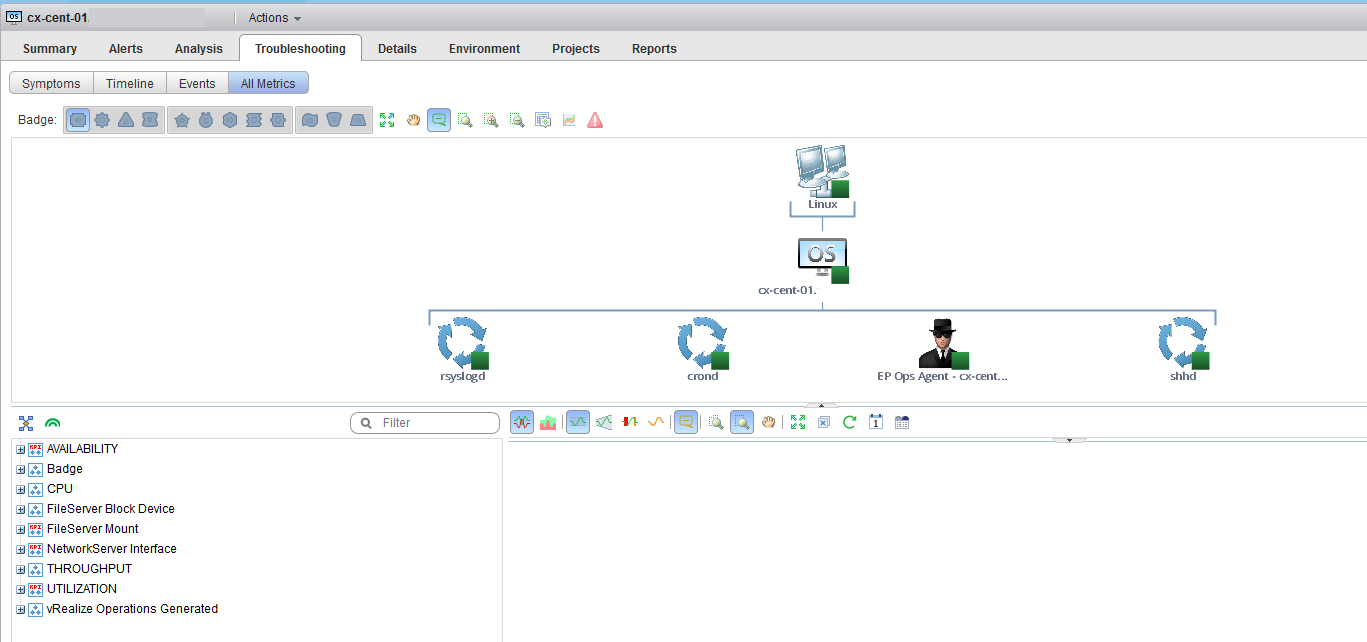
The Objective
The following picture depicts the target we’re looking for and can be viewed from within the vRealize Operations Console.
Creating the MultiProcess Object for a single Linux Machine
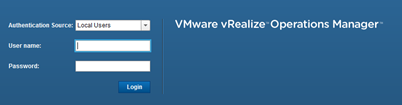
- Log into vRealize Operations using an appropriate account
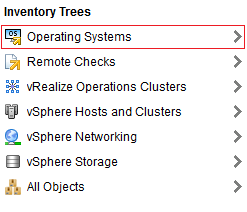
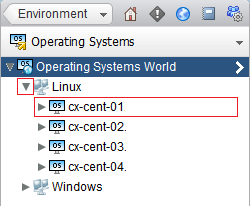
- Select Environment

- Select Operating Systems
- Click the > to expand the selection under Operating Systems World
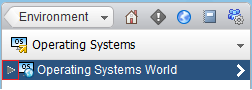
- Click the > to expand the selection under Linux and click on the target machine (cx-cent-01)
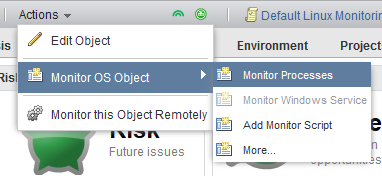
- The click Actions, select Monitor OS Object and then select Monitor Processes.
- At the Monitor Processes dialog, enter the Display Name and process.query for the process you want to monitor, in this instance I’m using
State.Name.eq=crond
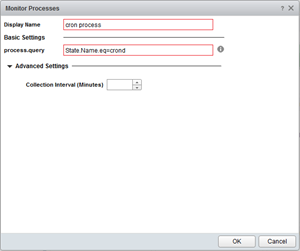
- Click OK.
- You can repeat the steps for as many processes as you need to monitor.
- You can also choose to change the default collection interval by selecting Advanced Settings and changing the value of Collection Interval (Minutes).
- Click the Troubleshooting Tab and select All Metrics to display your creation(s)
That’s great for one machine, but how can I do that on multiple machines? Everything will come clearer when you follow the next few posts!
Published on 20 April 2016 by Christopher Lewis. Words: 409. Reading Time: 2 mins.